Recurrence Networks
Recurrence matrices can be reinterpreted as adjacency matrices of complex networks embedded in state space, such that each node or vertex of the network corresponds to a point of the timeseries, and the links of the network connect pairs of points that are mutually close the phase space. The relationship between a recurrence matrix $R$ and its corresponding adjacency matrix $A$ is:
\[R[i,j] = A[i,j] - \delta[i,j]\]
i.e. there is an edge in the associated network between every two neighboring points in the phase space, excluding self-connections (points in the Line Of Identity or main diagonal of $R$).
This definition assumes that $A$ represents an undirected graph, so $R$ must be a symmetric matrix as corresponding to a RecurrenceMatrix or a JointRecurrenceMatrix.
While RQA characterizes the properties of line structures in the recurrence plots, which consider dynamical aspects (e.g. continuity of recurrences, length of sequences, etc.), the analysis of recurrence networks does not take into account time information, since network properties are independent of the ordering of vertices. On the other hand, recurrence network analysis (RNA) provides information about geometric characteristics of the state space, like homogeneity of the connections, clustering of points, etc. More details about the theoretical framework of RNA can be found in the following papers:
- R.V. Donner et al. "Recurrence networks — a novel paradigm for nonlinear time series analysis", New Journal of Physics 12, 033025 (2010)
- R.V. Donner et al. "Complex Network Analysis of Recurrences", in: Webber, C.L. & Marwan N. (eds.) Recurrence Quantification Analysis. Theory and Best Practices, Springer, pp. 101-165 (2015).
Creation and visualization of Recurrence Networks
The JuliaGraphs organization provides multiple packages for Julia to create, visualize and analyze complex networks. In particular, the package LightGraphs defines the type SimpleGraph that can be used to represent undirected networks. Such graphs can be created from symmetric recurrence matrices, as in the following example with a Hénon map:
using RecurrenceAnalysis, DynamicalSystemsBase
using Graphs: SimpleGraph

# make trajectory of Henon map
henon_rule(x, p, n) = SVector(1.0 - p[1]*x[1]^2 + x[2], p[2]*x[1])
u0 = zeros(2)
p0 = [1.4, 0.3]
henon = DeterministicIteratedMap(henon_rule, u0, p0)
X, t = trajectory(henon, 200)
# Cast it into a recurrence network
R = RecurrenceMatrix(X, 0.25; metric = Chebyshev())
network = SimpleGraph(R)
{201, 2945} undirected simple Int64 graphThere are various plotting tools that can be used to visualize such graphs. For instance, the following plot made with the package GraphMakie.jl.
using GraphMakie, CairoMakie
graphplot(network)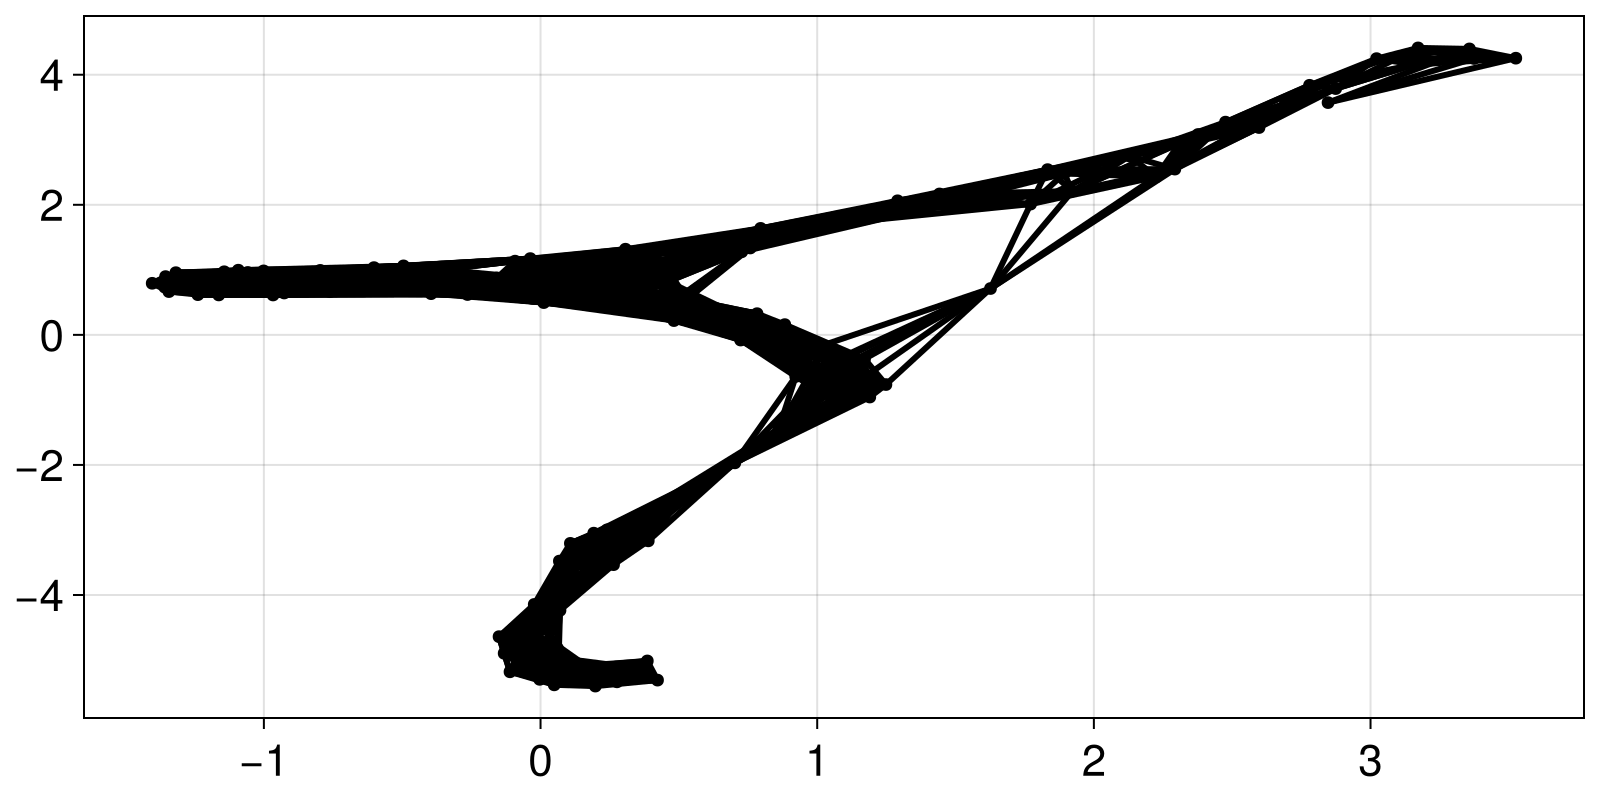
Recurrence Network measures
LightGraphs has a large set of functions to extract local measures (associated to particular vertices or edges) and global coefficients associated to the whole network. For SimpleGraphs created from recurrence matrices, as the variable network in the previous example, the vertices are labelled with numeric indices following the same ordering as the rows or columns of the given matrix. So for instance degree(network, i) would give the degree of the i-th point of the timeseries (number of connections with other points), whereas degree(network) would give a vector of such measures ordered as the original timeseries.
As in RQA, we provide a function that computes a selection of commonly used global RNA measures, directly from the recurrence matrix:
RecurrenceAnalysis.rna — Function
rna(R::AbstractRecurrenceMatrix)
rna(args...; kwargs...)
Calculate a set of Recurrence Network parameters. The input R can be a symmetric recurrence matrix that is interpreted as the adjacency matrix of an undirected complex network, such that linked vertices are neighboring points in the phase space.
Alternatively, the inputs can be a graph object or any valid inputs to the SimpleGraph constructor of the Graphs package.
Return
The returned value is a dictionary that contains the following entries, with the corresponding global network properties[1, 2]:
:density: edge density, approximately equivalent to the global recurrence rate in the phase space.:transitivity: network transitivity, which describes the
global clustering of points following Barrat's and Weigt's formulation [3].
:averagepath: mean value of the shortest path lengths taken over
all pairs of connected vertices, related to the average separation between points in the phase.
:diameter: maximum value of the shortest path lengths between
pairs of connected vertices, related to the phase space diameter.
References
[1]: R.V. Donner et al. "Recurrence networks — a novel paradigm for nonlinear time series analysis", New Journal of Physics 12, 033025 (2010) DOI:10.1088/1367-2630/12/3/033025
[2]: R.V. Donner et al., The geometry of chaotic dynamics — a complex network perspective, Eur. Phys. J. B 84, 653–672 (2011) DOI:10.1140/epjb/e2011-10899-1
[3]: A. Barrat & M. Weight, "On the properties of small-world network models", The European Physical Journal B 13, 547–560 (2000) DOI:10.1007/s100510050067
The concept of clustering coefficient at local level (for individual nodes of the network) is clearly defined as the fraction of connecting nodes that are also connected between them, forming "triangles". But at global level it is a source of confusion: the term of "global clustering coefficient" was originally used by Watts and Strogatz[1], referred to the average of local clustering coefficient across all the graph's nodes. But Barrat and Weigt proposed an alternative definition[2] that characterizes the effective global dimensionality of the system, giving equal weight to all triangles in the network[3].
This second definition is often named with the distinctive term of "transitivity", as in the output of rna, whereas the corresponding function of the LightGraphs package is global_clustering_coefficient. The "global clustering coefficient" as by Watts and Strogatz could be obtained as mean(local_clustering_coefficient(network)) – with network being a graph object as in the previous example. (The function mean is in the Julia standard library, and can be brought into scope with the command using Statistics.)
- 1D.J. Watts & S.H. Strogatz, "Collective dynamics of 'small-world' networks", Nature 393(6684), 440–442 (1998) DOI:10.1038%2F30918
- 2A. Barrat & M. Weight, "On the properties of small-world network models", The European Physical Journal B 13, 547–560 (2000) DOI:10.1007/s100510050067
- 3R.V. Donner et al. "Recurrence networks — a novel paradigm for nonlinear time series analysis", New Journal of Physics 12, 033025 (2010) DOI:10.1088/1367-2630/12/3/033025